A drop that lasts a minute is gone before you can open a speed test. To prove it happens, you need something that keeps checking and writes down the time of every failure. The free way is ping in Terminal. Netutilus adds loss per hop over time, an outage log, notifications and reports you can send to your provider.
What counts as a drop
“The internet dropped” can mean three different failures. Log at least the first two side by side, so you can tell them apart later:
| What failed | What you notice | How to see it from the Mac |
|---|---|---|
| The Wi-Fi link or the router | Nothing loads | Pings to your router time out |
| The internet past the router | Nothing loads, but the Mac is still on the Wi-Fi | The router answers, 1.1.1.1 does not |
| DNS | Pages fail to open by name | 1.1.1.1 answers, but dig apple.com fails or takes seconds |
If the router stops answering too, the problem is on your side: a weak Wi-Fi signal, interference or the router itself. If only the internet side fails, it is the modem, the line or your provider.
Find your router’s address first:
route -n get default | awk '/gateway/ {print $2}'
192.168.1.1
Free: a timestamped ping log in Terminal
macOS ping has an option that Apple added, --apple-time, which prints the time each reply arrived. Timeouts get a time stamp too, so the log shows when a drop started and when it ended.
- Open Terminal (Applications › Utilities).
- Start the log.
caffeinate -ikeeps the Mac from idle sleep while the command runs, andtee -ashows each line and appends it to a file:
caffeinate -i ping --apple-time 1.1.1.1 | tee -a ~/ping-log.txt
PING 1.1.1.1 (1.1.1.1): 56 data bytes
13:09:05.308253 64 bytes from 1.1.1.1: icmp_seq=0 ttl=59 time=13.737 ms
13:09:06.327103 64 bytes from 1.1.1.1: icmp_seq=1 ttl=59 time=27.450 ms
13:09:07.315702 64 bytes from 1.1.1.1: icmp_seq=2 ttl=59 time=13.842 ms
A lost probe looks like this:
13:09:15.547115 Request timeout for icmp_seq 0
13:09:16.551761 Request timeout for icmp_seq 1
--apple-timeprints the time without the date. For a log that runs overnight or for days, put the date in front of every line instead:
caffeinate -i ping 1.1.1.1 | while read -r line; do echo "$(date '+%F %T') $line"; done | tee -a ~/ping-log.txt
2026-10-20 13:09:53 PING 1.1.1.1 (1.1.1.1): 56 data bytes
2026-10-20 13:09:53 64 bytes from 1.1.1.1: icmp_seq=0 ttl=59 time=24.178 ms
2026-10-20 13:09:54 64 bytes from 1.1.1.1: icmp_seq=1 ttl=59 time=12.951 ms
- Open a second Terminal window and run the same command for your router, writing to its own file: replace
1.1.1.1with the router’s address andping-log.txtwithrouter-log.txt. - Leave both running while the problem happens. Press Control-C to stop.
- Count the lost probes, then list each drop from its first to its last lost probe. The
awkline reads the dated log from step 3:
grep -c "Request timeout" ~/ping-log.txt
awk '/Request timeout/ { if (!n) start = $1 " " $2; end = $2; n++; next } /bytes from/ && n { print start " to " end ": " n " probes lost"; n = 0 }' ~/ping-log.txt
On a test log with a simulated drop (two probes sent to an address that never answers), it prints:
2
2026-10-20 13:09:57 to 13:09:58: 2 probes lost
What to keep in mind with this log:
- One lost probe now and then is normal. Count a drop when several in a row are lost, and when the router log stays clean at the same moment.
- Some hosts and networks block or limit ping. If the log shows loss but nothing feels broken, log a second, different target before you blame the line.
caffeinate -iprevents idle sleep only. If the Mac sleeps anyway, for example when you close a laptop’s lid, nothing is recorded and the log has a gap.- The log grows by one line a second, roughly 6–7 MB a day with the dated version.
Watch it live: continuous ping with a chart
A text log is hard to read while a call is breaking up. Ping in Netutilus is free and draws each probe on a live chart, with lost probes marked as red bands where they happened.
- Open Ping in Netutilus.
- Enter
1.1.1.1(or your router’s address). - Choose the Mode: ICMP works like
pingin Terminal; TCP times a connection to a port, 443 by default, which almost every server answers. - Turn on Continuous, then click Start.
- Switch the chart from Last 50 to Whole run to see the full session.
The results can be exported as CSV or text. Ping shows how the line behaves right now; for a list of outages, use MTR or Uptime Monitor.
Log outages with exact start and end
MTR is part of Netutilus Pro. It is a traceroute that keeps running: it probes every router between your Mac and the target, so besides recording when the connection dropped, it shows at which hop the loss started. The open-source mtr usually needs Homebrew and sudo on a Mac.
- Open MTR, enter
1.1.1.1and press Return. - Leave it running while the problem happens. Hours or days are fine.
- Switch the view from Route to History. The heatmap shows loss per hop over time, and the outage log lists every stretch when the destination stopped answering.
- Use Export Outages (CSV)… for the list, or Export Report (PNG)… for a picture of the history.
The CSV has one row per outage, oldest first:
Start,End,Seconds,LostProbes,TTL
How MTR decides what an outage is:
- Two or more lost probes in a row to the destination. A single lost probe is not logged.
- Loss at a router in the middle of the path is not an outage. Routers often ignore probes addressed to themselves while passing your traffic untouched.
- If the Mac slept, the gap ends the outage instead of stretching it across the night.
- Outages are kept exactly, even in a recording that runs for days.
Get notified and keep a report
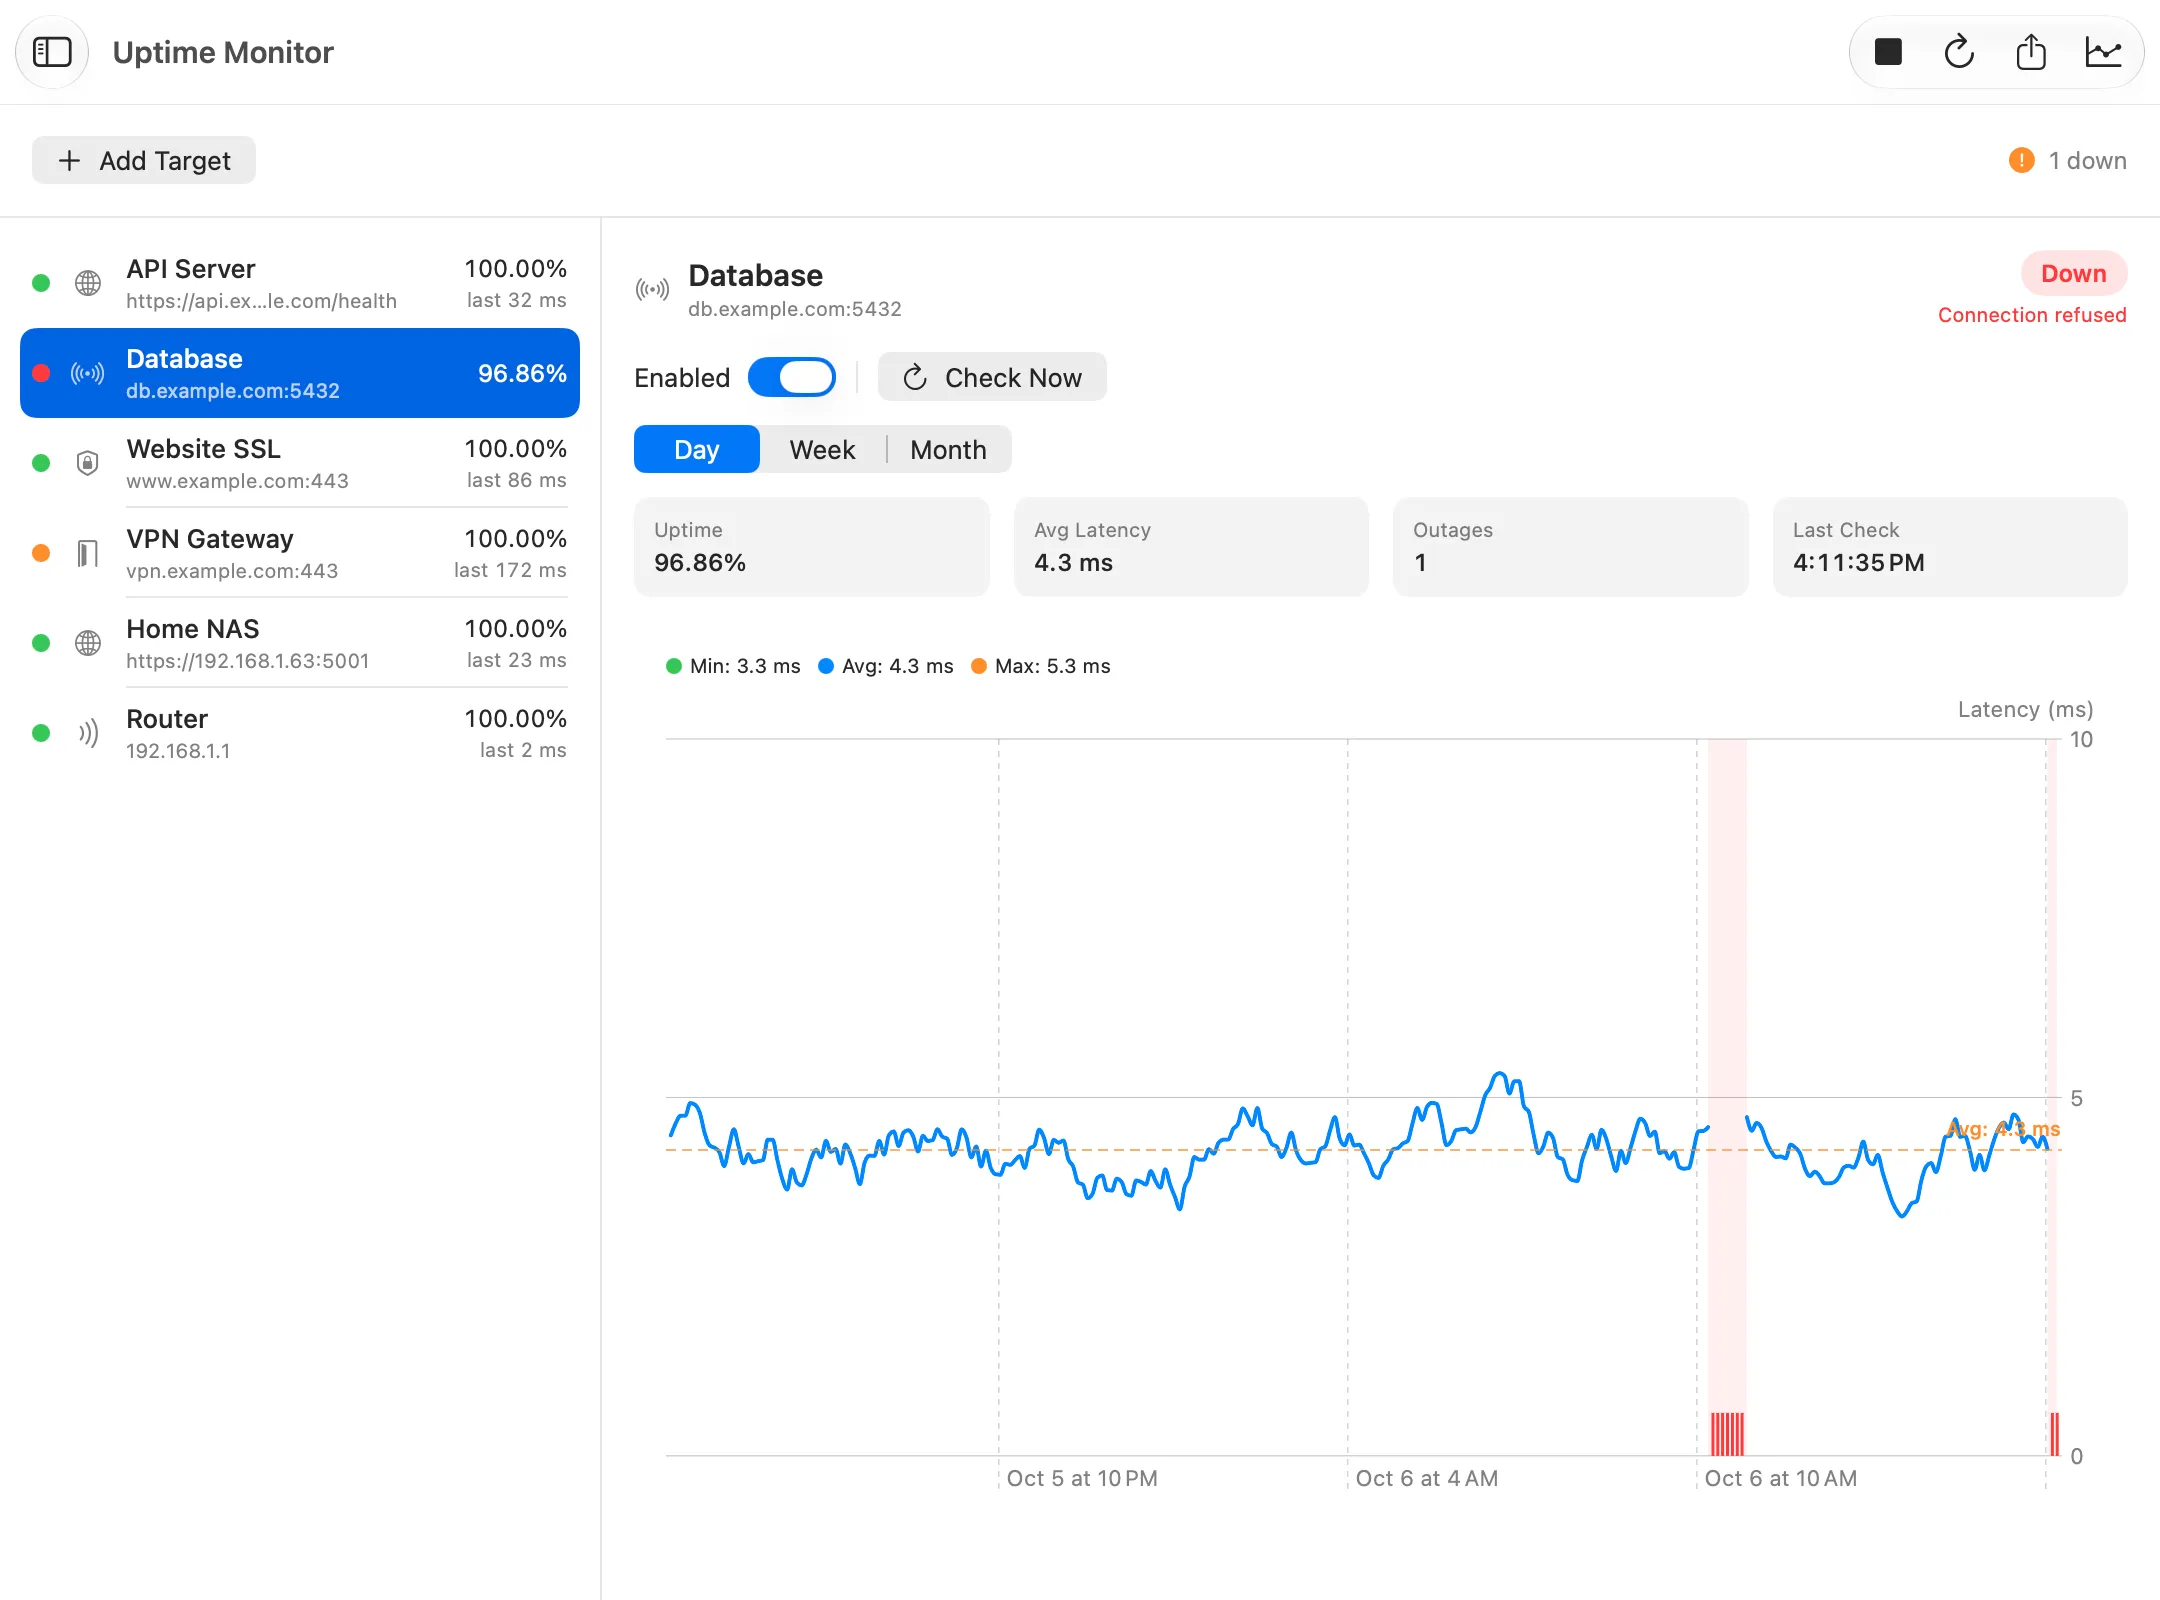
Uptime Monitor, also in Netutilus Pro, checks a list of targets on a schedule, notifies you when one goes down, shows the status in the menu bar and keeps the history. A target can be the internet itself.
- Open Uptime Monitor and click Add Target.
- Name: Internet. Check Type: Ping (ICMP). Host:
1.1.1.1. - Check Interval: 30 seconds is the default; you can choose from 15 seconds to 15 minutes.
- Under Alerts, keep Notify when down on. Failures before down is 3 by default: three failed checks in a row make an outage.
- Click Add. Then add a second target for your router’s address the same way.
When a target fails, macOS shows a Host Down notification, and Host Recovered when it answers again. Allow notifications for Netutilus in System Settings, or you will only see the status in the app and the menu bar. There are no phone or chat alerts in the current version.
To keep a record, pick a period and use Export › Uptime Report (PDF)…. A chart image (PNG), CSV and JSON are in the same menu. The report states its own rule: an outage starts at the first failed check and ends at the next check that answered.
Note: Uptime Monitor stops checking while the Mac itself is offline or asleep, and marks that time as not monitored, not as an outage. So if your Wi-Fi link drops completely, the record of it is a gap with its start and end, not an outage.
Speed over time
A line can stay up and still slow down every evening. That is a different complaint from a drop, and it needs speed measured at different times of day.
For a single reading in Terminal, macOS has networkQuality:
networkQuality
==== SUMMARY ====
Uplink capacity: 9.373 Mbps
Downlink capacity: 15.305 Mbps
Responsiveness: Low (2.099 seconds | 28 RPM)
Idle Latency: 26.726 milliseconds | 2245 RPM
Speed Test in Netutilus is free and adds a bufferbloat grade. Its History, part of Pro, runs the test on a schedule:
- Open Speed Test and go to History.
- Turn on Run automatically and pick how often under Every: from 30 minutes to 24 hours.
- Keep Skip on metered connections on if you sometimes use a hotspot: one run can transfer up to about 1 GB.
- After a few days, export the ISP report (PNG), a CSV, or Copy summary as plain text for a support ticket.
The report says it was measured from a single device, so over Wi-Fi it measures your Wi-Fi too. Runs over a cable are the stronger evidence about the line.
What to send your provider
Give your provider times and durations. Before you call:
- Connect the Mac to the modem or router with a cable and keep logging. Providers usually ask for that first.
- Collect the drops with their date, start, end and length: the
awksummary from Terminal, MTR’s outage CSV or the Uptime Monitor PDF. - Show that your side was fine: the router log or router target stayed up while the internet target failed. A quick Internet Check during a bad moment shows the same split, and its report can be saved as an image.
- If speed is the complaint, add the Speed Test history report.
A short message could look like this:
Since 14 October my connection drops several times a day.
Logged from a Mac on a cable to the router:
  2026-10-18 21:14:05 to 21:16:40  (2 min 35 s)
  2026-10-19 08:02:11 to 08:02:58  (47 s)
The router answered throughout; 1.1.1.1 did not.
Logs attached.
The dates and times in that message are an example; use your own. For the full routine of finding whose fault a bad connection is, see the internet is slow or keeps dropping.
Other Mac apps for this
If you only want a menu bar light that turns red when the internet is gone, a small single-purpose app may suit you better.
Facts checked on 2026-10-20, from each developer’s page and the Mac App Store.
| App | What it does | Requires | Licence | Version |
|---|---|---|---|---|
| Online Check (Sindre Sorhus) | Menu bar icon turns red when you are offline, optional notification, a history screen for the day | macOS 26.0 or later | Paid | 1.6.1 |
| NetCheck - Menu Bar Monitor | A green or grey dot in the menu bar, notifications when the internet drops and returns; history, CSV export and iPhone alerts in Pro | macOS 15.0 or later | Free, with in-app purchases | 2.3.7 |
Where they are better: both sit in the menu bar with almost no setup, and NetCheck Pro can push an outage alert to your iPhone, which Netutilus does not do. Netutilus is the better fit when you need to know where the loss starts, separate the router from the provider, and hand over a report with exact times.
Commands tested on macOS 27.0.1 on 2026-10-20.